

|
Note: This article assumes the reader's familiarity with the fictitious GeekGold economy at the BoardGameGeek website.
It's time for my biannual update on the state of the GeekGold. The last time I did this was April 1, 2008, which prompted someone to ask if this was all an elaborate April Fool's joke because they had no idea that GeekGold was worth actual money. This is certainly not a joke. GeekGold is worth more than many national currencies. If you're not familiar with the auctions in which people offer a set amount of U.S. dollars and BGG users bid how much GeekGold they will pay to receive that money, then check them out.
There have been 386 such auctions over the past three years, since the Auction feature of BGG was created in January 2006. In fact, over that time, a grand total of $5,422.65 has been exchanged for 42,168 GeekGold. This make for an average exchange rate of 7.8 GeekGold per $1. Or to put it another way, it means 1 GeekGold has had an average value of 12.9 cents. Of course the value of GeekGold has fluctuated over the past 3 years, and particularly over the past 7 months since my last post on this subject, so now it's time for your bi-annual post of charts and graphs galore.
Before I go any further, let me point out my previous three threads on this subject so that you can see those for background if you didn't catch them the first time around. The first thread was on May 7, 2007, where I pointed out that an avatar, geekbadge, ubergeekbadge, and five microbadges cost approximately $29.41 worth of GeekGold. The second thread was on September 24, 2007, where I introduced the concept of analyzing the liquidity of GeekGold and graphed the increasing frequency of opportunities to exchange GeekGold for U.S. dollars. The third thread was on April 1, 2008, where I finally conceded a bit of GeekGold inflation, as the value of GeekGold had fallen to its lowest point in many months. Without further ado, it's time for my fourth thread analyzing the value of GeekGold.
The first chart I'm going to show you is a chart summarizing all of the GeekGold that has been exchanged for U.S. dollars since the very first auction where this occurred on January 17, 2006. I've provided the overall totals and the totals for each individual year. In addition, you can see the average amount of GeekGold it takes to get $1 and the average value of GeekGold in pennies, for each of those intervals.

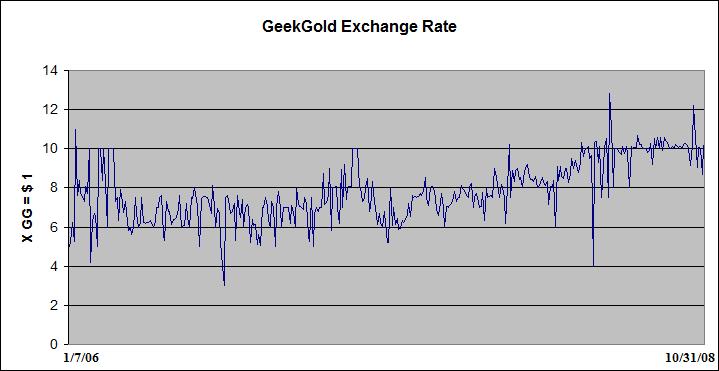
Next up is a graph that plots every single auction in which GeekGold was exchanged for U.S. dollars. This graph includes all 386 such auctions that have occurred in the history of U.S. dollars being auctioned off for GeekGold. You can see below that the number of GeekGold necessary to get $1 has fluctuated from an all-time low of 3 to an all-time high of 12.8. You'll also see that the number of GeekGold necessary to get $1 has trended upwards, especially in the past few months, hovering around 10 more consistently than ever before. Maybe it will plateau there or maybe the current seeming stability will be short-lived, only time will tell.
The second graph of the day is a new and never before seen graph that displays the value of a GeekGold in pennies for all 386 auctions. You can see here that the value started at approximately 19 cents and has fluctuated quite a bit before settling right around 10 cents lately.

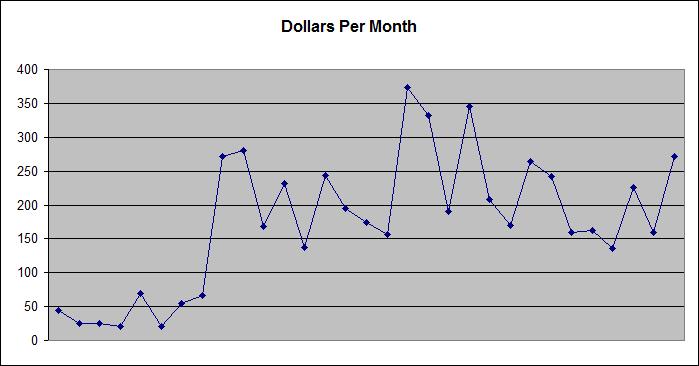
That chart and those two graphs ought to be enough for you, no? But in case you want even more data to mull over, I'll provide now a chart with more numbers than you can shake a stick at. This chart breaks down the value of GeekGold by month, from January 2006 through October 2008. For each month, I provide the average number of GeekGold it took to get $1 as well as the average value of a GeekGold in pennies. In addition, this chart includes a section on liquidity per month. This means that you can see the number of auctions per month, the total amount of GeekGold exchanged in those auctions per month, the total amount of U.S. dollars exchanged in all of the auctions each month, and the average amount of GeekGold and U.S. dollars exchanged in each auction in a given month. You'll see that the liquidity of GeekGold (i.e., the ease and frequency with which it can be converted back and forth to U.S. dollars) shot up quickly after the first few months, and has fluctuated over the past couple years, but has not displayed any upward trend lately. In fact, the peak was reached back in September 2007 when there was an all-time high of 30 auctions in which 3011 GeekGold was exchanged for $372.76. In contrast, the past six months have seen 12, 10, 10, 22, 16, and 17 auctions in which U.S. dollars were exchanged for GeekGold. Following this chart, I will provide seven graphs, one for each column in this chart.
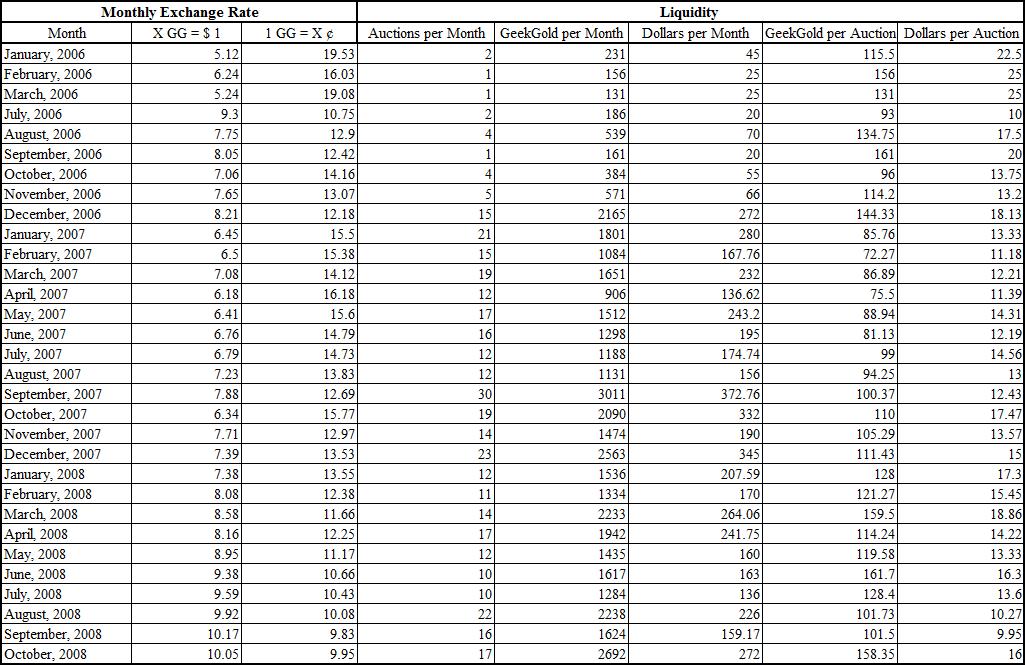
As you can see, the first column is the monthly average amount of GeekGold it takes to get $1. So you could probably guess that the first in this series of graphs will be a graph depicting that monthly average.
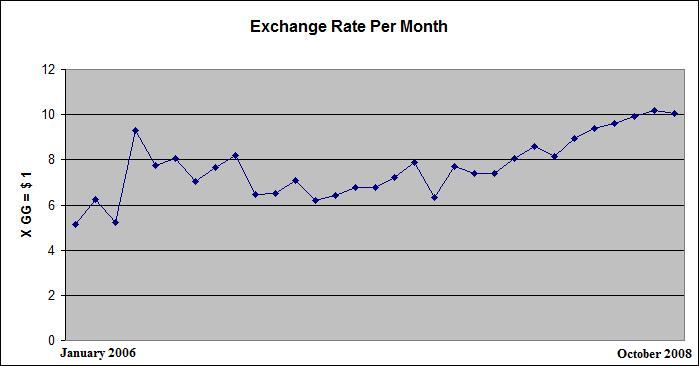
The second graph depicts the monthly average amount that a GeekGold has been worth in pennies.

The next five graphs show the liquidity of GeekGold. First comes a graph of the number of auctions that have been held per month in which U.S. dollars have been auctioned off for GeekGold.

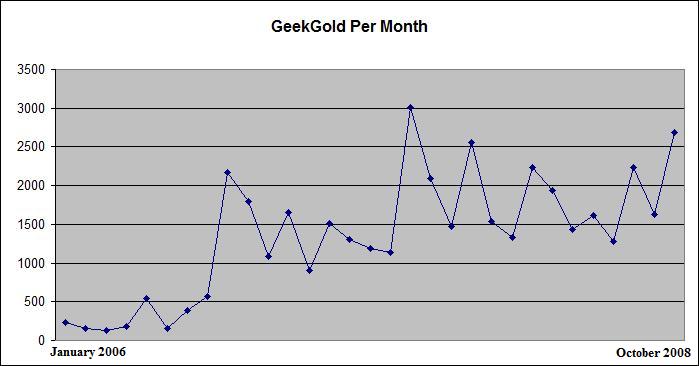
Next is a graph depicting the total amount of GeekGold that was exchanged in those auctions each month.
 ]
]
Followed by a graph of the total amount of U.S. dollars that were exchanged in those auctions per month.
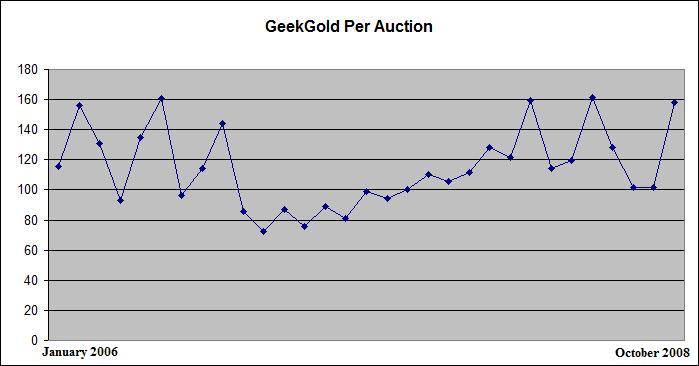
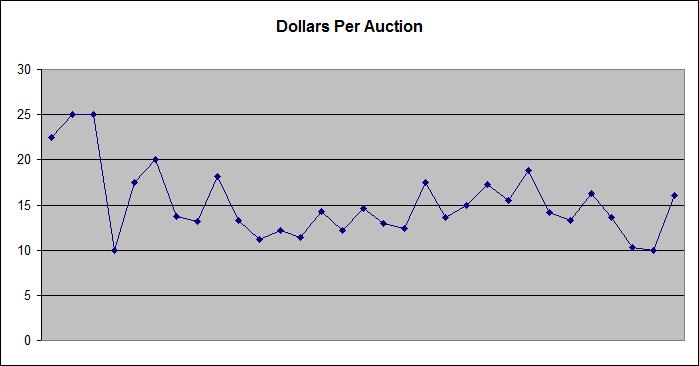
Finally we come to a pair of graphs. One shows the average amount of GeekGold exchanged per auction in each month. The other shows the average amount of U.S. dollars exchanged per auction in each month. You can see that the size of auctions in terms of the average amount of GeekGold and the average amount of U.S. dollars exchanged in any given auction has fluctuated over the past 3 years but has not trended upwards or downwards over that time.
That should be more than enough information about the value of GeekGold to quench your thirst for data, charts, and graphs. If you're interested in reading more discussions that mix economics with gaming then check out my latest article on The Bulls & Bears of Gaming.
Look on the bright side. While your precious Avatar was worth $4.30 in 2007 and is down to only $3.35 in 2008, at least now you have to spend less cash to buy all those microbadges you're dying to get, assuming you don't feel like breaking out your digital camera and you don't have the attention span for GeekMod. At least now you only have to spend $16.73 to get enough GeekGold to buy 10 microbadges, whereas all your fellow BGG users who just had to have their microbadges in 2007 were spending $21.50 for the privilege. The question you have to ask yourself now is whether it makes sense to invest all your savings in GeekGold in hopes that 2009 ends up being more like 2007, in which case you could make a killing. Or do you think GeekGold will finally fall below the 10 cents mark for good, as has been the trend over the past two months. There's money to be made (or lost) in this fictitious economy. Hopefully I've entertained you enough to earn something with this thread. Don't forget to be generous since the value of GeekGold has been down of late.
If you're curious about all the ways to earn and spend GeekGold then check out the excellent wiki page on the subject. Go forth to earn and spend that GeekGold and make our GeekEconomy thrive with bustling GeekActivity!
(See the Excel file for all of the raw data)
(See this Forum Thread for this article plus additional comments on it)